NEWS: Our Blog

8 Essential Characteristics of LC-MS/MS Method Validation

Jul 4, 2023 12:01:32 PM / by Alliance Pharma posted in Pharmaceuticals, lc-ms/ms


Liquid chromatography-tandem mass spectrometry (LC-MS/MS) is a powerful technique in the field of bioanalysis, and it plays a critical role in drug development and clinical trials. This method has a well-earned reputation for high selectivity, sensitivity, and specificity for the detection and quantification of low levels of target analytes in complex matrices. The development and validation of a new LC-MS/MS bioassay is a complex and demanding process that involves assessing its performance via analytical characteristics. Even experienced scientists can face pitfalls when developing and validating a new bioassay, so to ensure that the LC-MS/MS method is reliable and accurate, it is essential to validate the method.

Here, we will summarize the eight essential characteristics of LC-MS/MS method validation, then explain why it is important that you work with an experienced contract research organization (CRO) to ensure quality in each of these areas: 

  1. Accuracy
  2. Precision
  3. Specificity
  4. Quantification Limit
  5. Linearity
  6. Recovery
  7. Matrix Effect
  8. Stability 

1. Accuracy

Accuracy refers to the difference between the measured value and the true value of the analyte. Scientists assess the accuracy of an LC-MS/MS method by comparing the measured concentration of the analyte in the sample to the known concentration of the analyte in a standard solution. Even small inaccuracies can lead to significant errors in the final concentration of the analyte, resulting in ill-informed decisions and, potentially, the risk of underdosing or overdosing a patient.

2. Precision 

In LC-MS/MS method validation, precision refers to the degree of agreement between the results obtained through multiple measurements of the same sample under the same conditions, and it is assessed by calculating the variability of these results. Precise results are essential for reducing uncertainty in the final concentration of the analyte and ensuring the reproducibility of the method.

3. Specificity

Specificity refers to the ability of the method to accurately measure the target analyte in the presence of other sample components. This can be assessed by analyzing samples that contain the analyte of interest as well as other potentially interfering substances. Specificity is essential in LC-MS/MS method validation because it ensures that the method can accurately measure the analyte of interest without interference from other components in the sample.

4. Quantification Limit

The quantification limit is the lowest concentration of the analyte that can be reliably and accurately measured by the method. This is determined by analyzing samples with decreasing concentrations of the analyte until the signal-to-noise ratio (S:N) reaches a predefined level (20:1 to enable an increased chance it will be suitable). Defining the quantification limit is key because it provides an idea of what sort of sample extraction technique is needed, as well as determining the sensitivity of the method and the lowest concentration that can be reported. These are crucial to ensuring the accuracy of your results.

5. Linearity

Linearity is the ability of the method to produce results that are directly proportional to the analyte concentration over a defined range. In LC-MS/MS method validation, linearity is determined by analyzing samples with increasing concentrations of the analyte and plotting the response against the concentration. Linearity is essential because it ensures that the method can accurately measure a wide range of analyte concentrations. 

6. Recovery

Recovery refers to the ability of the method to accurately measure the analyte in the sample after the sample has undergone extraction or other sample preparation procedures. Recovery is assessed by spiking the sample with a known amount of the analyte and comparing the measured value to the expected value. This process is essential because it determines the accuracy of the method for your specific sample matrix.

7. Matrix Effect

Matrix effect is the interference caused by the sample matrix on the ionization and detection of the analyte. Matrix effect is evaluated by comparing the response of the analyte in the sample matrix to its response in a pure solvent. The method should be able to accurately measure the analyte in the presence of the sample matrix without interference. This is essential because interference from the sample matrix or metabolites can impact the accuracy and precision of the method and cause variations in the analyte concentration. Careful validation is essential for optimizing methods that eliminate or minimize these risks.

8. Stability


Stability is the ability of the analyte to remain stable in the sample matrix under the conditions of storage and processing over time. It is evaluated by analyzing the samples at different time intervals and temperatures and comparing the results, across which the analyte should remain stable. Stability is essential to ensure that the method can provide accurate, reliable and consistent results.

The Key to Quality in All Eight Areas

Developing and validating a new bioassay using LC-MS/MS is a complex process that requires expensive instrumentation, advanced software, and, most importantly, tremendous expertise. Your CRO partner should have a team of scientists with the depth of expertise in LC-MS/MS method development and validation to ensure excellence in each of the eight essential categories listed above. To do this successfully, they should have access to state-of-the-art instrumentation and analytical techniques and be able to guarantee that the bioassay meets all regulatory requirements. That is the way to ensure that the method is carefully optimized and validated for your specific sample matrix, delivering the insights needed to make confident decisions for your program.

In the biopharmaceutical industry, LC-MS/MS assays require accurate, precise, and robust methods developed in the shortest time possible. At the UK lab of Resolian, we have successfully employed a protocol that reaches these goals consistently and efficiently. This achievement has enhanced our capabilities across the Resolian organization: Fordham and Sandwich (U.K.); Malvern, PA (USA); Brisbane (AUS).

Read the guide to discover our powerful approach to developing LC-MS/MS bioassays.

Read More

9 Bioanalytical Studies using LC-MS/MS

Feb 21, 2017 3:23:50 PM / by Dr. Feng Li posted in lc-ms/ms


Over the years, our scientists have been tasked with a variety of complex LC-MS/MS studies. In their research, they worked to produce cost-saving procedures, deliver reproducible results, and employ automation technologies. 

Here is an overview of the Bioanalytical study research presented at scientific conferences over the past four years. Click the links to view the full poster; including analysis, details, and conclusions.

lc ms ms word cloud lc ms ms tandem mass spectrometry mass spectrometry analysis bioanalysis method validation what is mass spectrometry how to read mass spectrometry test method validation method development analytical method validation preclinical studies bioanalytical method validation hplc ms ms lc mass spec bioanalytical laboratory services mass spectrometry validation of an analytical method method validation steps analytical method development lc ms ms analysis mass spect mass spectrometry lc lc ms ms method development and validation mass spectro meter pk pharmacokinetics bioanalytical services what is lc-ms lc mass spectrometry mass spectrometry ms lc lc ms mass spectrometry lc-ms/ms lc-ms lc msms method development

1.) Prove Microsampling accuracy with LC-MS/MS 

Mouse Pharmacokinetic Study of Ceftriaxone Using Mitra™ Microsampling Devices and LC-MS/MS

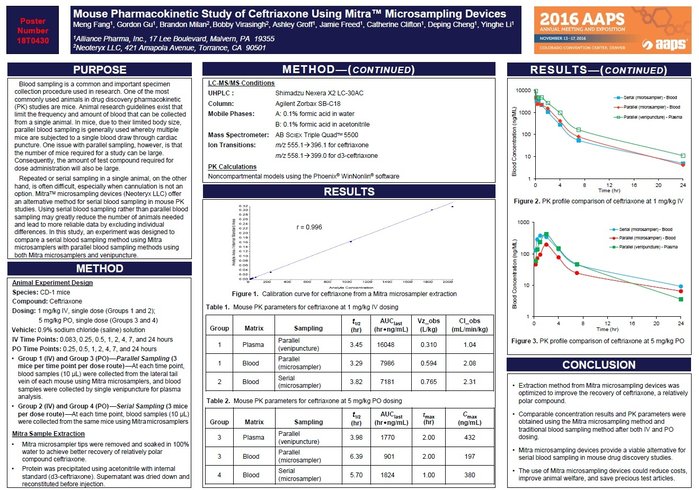
In this study, an experiment was designed to compare a serial blood sampling method using Mitra™ microsamplers with parallel blood sampling methods using both Mitra™ microsamplers and venipuncture.

2.) Automate the work of quantifying S1P in Human Plasma using LC-MS/MS

Method Development and Validation for the Quantification of D-erythro-Sphingosine-1-phosphate (S1P) in Human Plasma Using LC-MS/MS

An automation friendly LC-MS/MS method with a calibration range of 10 to 400 ng/mL was developed and validated to support clinical trials using S1P as a biomarker.

3.) Quantify HMF and HMFA in Human Plasma with LC-MS/MS

Method Development and Validation for the Quantitation of HMF and HMFA in Human Plasma Using LC-MS/MS

A method for the quantitation of HMF and one of its major metabolites, 5-hydroxymethyl-2-furoic acid (HMFA), has been developed and validated in commercially available human plasma by Alliance Pharma. 

lc ms ms alliance pharma scientists

4.) Confirm stability with rapid and sensitive LC-MS/MS method

SHORTCUT to CYP Enzyme Activity Monitoring

A rapid and sensitive LC-MS/MS method was validated for cortisol and 6ß-HC analysis
in human urine. Method accuracy, precision, repeatability, selectivity, F/T stability, processed sample stability, bench-top stability, and long term stability have been confirmed.

5.) Evaluate drug-drug interactions during LC-MS/MS clinical studies

Quantification of 4b-Hydroxycholesterol and Cholesterol in Human Plasma Using LC-MS/MS

The plasma concentration ratio of 4b-hydroxycholesterol (4b-HC) to cholesterol has been recognized as a reliable marker for the assessment of Cytochrome P450 (CYP) 3A4 activity. It could be a valuable yet simple and cost effective side-product of a clinical study to evaluate CYP3A4-mediated drug-drug interactions.

6.) Support a Phase I clinical study with an LC-MS/MS method

Method Development and Validation for the Quantitation of ManNAc in Human Plasma Using HILIC LC-MS/MS

The purpose of this study was to develop and validate an LC-MS/MS method for assaying N-acetylmannosamine (ManNAc) in human plasma (K2EDTA) to support a phase I clinical study.

7.) Measure Goserelin in human plasma using LC-MS/MS

A Rapid and Sensitive Method for the Quantification of Goserelin in Human Plasma Using HPLC-MS/MS

The purpose of this study was to develop and validate a rapid and sensitive LC-MS/MS method for measuring Goserelin in human plasma (K2EDTA).

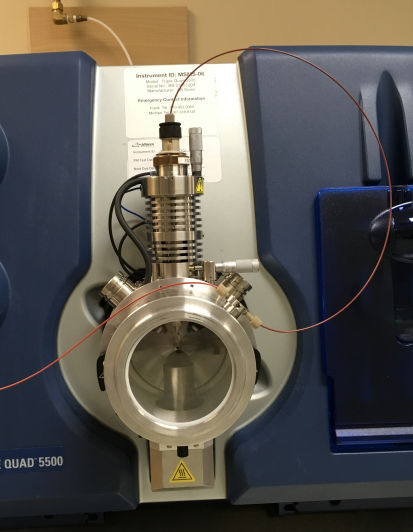
mass spectrometer.png

8.) Determine the quantification of 25-hydroxyvitamin D3 with an LC-MS/MS method

Quantification of 25-hydroxyvitamin D3 in Rat Serum Using Derivatization to Enhance LC-MS/MS Sensitivity

In this study, a sensitive and robust LC-MS/MS method was developed and validated for the determination of 25-OHVD3 in rat serum.

9.) Quantify Mercaptoethanol through LC-MS/MS analysis

Quantification of 2-Mercaptoethanol in Bulk Drug Substance by LC-MS/MS

Here, we report a LC-MS/MS method that utilizes derivatization with picolinic acid to quantitatively analyze residual mercaptoethanol and has been successfully used in biopharmaceutical manufacture.


Read More

Mouse Pharmacokinetic Study of Ceftriaxone Using Mitra™ Microsampling Devices and LC-MS/MS

Oct 21, 2016 1:32:00 PM / by Dr. Feng Li posted in lc-ms/ms

Purpose

Blood sampling is a common and important specimen collection procedure used in research. One of the most commonly used animals in drug discovery pharmacokinetic (PK) studies are mice. Animal research guidelines exist that limit the frequency and amount of blood that can be collected from a single animal. In mice, due to their limited body size, parallel blood sampling is generally used whereby multiple mice are subjected to a single blood draw through cardiac puncture. Oneissue with parallel sampling, however, is that the number of mice required for a study can be large. Consequently, the amount of test compound required for doseadministration will also be large.
Repeated or serial sampling in a single animal, on the other hand, is often difficult, especially when cannulation is not an option. MitraTM microsampling devices (Neoteryx LLC) offer an alternative method for serial blood sampling in mouse PK studies. Using serial blood sampling rather than parallel blood sampling may greatly reduce the number of animals needed and lead to more reliable data by excluding individual differences. In this study, an experiment was designed to compare a serial blood sampling method using Mitra microsamplers with parallel blood sampling methods using both Mitra microsamplers and venipuncture.

microsampling lc-ms/ms

Method

Animal Experiment Design

Species: CD-1 mice
Compound: Ceftriaxone
Dosing: 1 mg/kg IV, single dose (Groups 1 and 2);
5 mg/kg PO, single dose (Groups 3 and 4)
Vehicle: 0.9% sodium chloride (saline) solution
IV Time Points: 0.083, 0.25, 0.5, 1, 2, 4, 7, and 24 hours
PO Time Points:0.25, 0.5, 1, 2, 4, 7, and 24 hours
•Group 1 (IV) and Group 3 (PO)-Parallel Sampling (3 mice per time point per dose route) - At each time point, blood samples (10 μL) were collected from the lateral tail vein of each mouse using Mitramicrosamplers, and blood samples were collected by single venipuncture for plasma analysis.
•Group 2 (IV) and Group 4 (PO)- Serial Sampling (3 mice per dose route) - At each time point, blood samples (10 μL) were collected from the same mice using Mitra microsamplers


Mitra Sample Extraction

•Mitra microsampler tips were removed and soaked in 100% water to achieve better recovery of relatively polar compound ceftriaxone.
•Protein was precipitated using acetonitrile with internal standard (d3-ceftriaxone). Supernatant was dried down and reconstituted before injection.

LC-MS/MS Conditions

UHPLC : Shimadzu Nexera X2 LC-30AC
Column: Agilent Zorbax SB-C18
Mobile Phases: A: 0.1% formic acid in water
B: 0.1% formic acid in acetonitrile
Mass Spectrometer: AB SCIEX Triple Quad TM5500
Ion Transitions: m/z555.1→396.1for ceftriaxone
m/z558.1→399.0 for d3-ceftriaxone

PK Calculations

Noncompartmental models using the Phoenix®WinNonlin®software

Conclusion

  • Extraction method from Mitra microsampling devices was optimized to improve the recovery of ceftriaxone, a relatively polar compound.
  • Comparable concentration results and PK parameters were obtained using the Mitra microsampling method and traditional blood sampling method after both IV and PO dosing.
  • Mitra microsampling devices provide a viable alternative for serial blood sampling in mouse drug discovery studies.
  • The use of Mitra microsampling devices could reduce costs, improve animal welfare, and save precious test articles.


Acknowledgements

Meng Fang, Gordon Gu, Brandon Milan,Bobby Virasingh, Ashley Groff, Jamie Freed, Catherine Clifton, Deping Cheng, Yinghe Li
Alliance Pharma, Inc., 17 Lee Boulevard, Malvern, PA 19355
Neoteryx LLC, 421 AmapolaAvenue, Torrance, CA 90501

Read More

Method Development and Validation for the Quantification of D-erythro-Sphingosine-1-phosphate (S1P) in Human Plasma Using LC-MS/MS

Nov 2, 2015 11:19:00 AM / by Dr. Feng Li posted in lc-ms/ms

D-erythro-Sphingosine-1-phosphate(S1P), a bioactive lysophospholipid, is an important mediator of inflammation, atherosclerosis, and cancer. S1P is proposed as a clinical biomarker and diagnostic variable in fundamental research, routine testing, and large-scale clinical trials due to its signaling transducer functions.

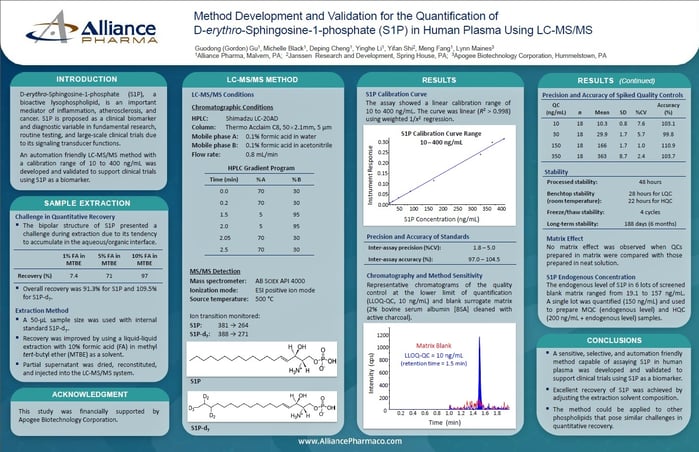
An automation friendly LC-MS/MS method with a calibration range of 10 to 400 ng/mL was developed and validated to support clinical trials using S1P as a biomarker.

LCMsMS method development.jpg

Sample Extraction

Challenge in Quantitative Recovery

The bipolar structure of S1P presented a challenge during extraction due to its tendency to accumulate in the aqueous/organic interface.

Overall recovery was 91.3% for S1P and 109.5% for S1P-d7.

Extraction Method

  • A 50-uL sample size was used with internal standard S1P-d7. 
  • Recovery was improved by using a liquid-liquid extraction with 10% formic acid (FA) in methyl tert-butyl ether (MTBE) as a solvent. 
  • Partial supernatant was dried, reconstituted, and injected into the LC-MS/MS system.


LC-MS/MS Method

LC-MS/MS Conditions

HPLC: Shimadzu LC-20AD

Column: Thermo Acclaim C8, 50x2.1mm, 5um

Mobile phase A: 0.1% formic acid in water

Mobile phase B: 0.1% formic acid in acetonitrile

Flow rate: 0.8 mL/min

MS/MS Detection

Mass Spectrometer: AB Sciex API 4000

Ionization mode: ESI positive ion mode

Source temperature: 500° C

Ion transition monitered:

S1P: 381 → 264

S1P-d7: 388 → 271

Results

S1P Calibration Curve

The assay showed a linear calibration range of 10 to 400 ng/mL. The curve was linear (R² > 0.998) using weighted 1/x² regression. 

Chromatography and Method Sensitivity

Representative chromatograms of the quality control at the lower limit of quantification (LLOQ-QC, 10 ng/mL) and blank surrogate matrix (2% bovine serum albumin [BSA] cleaned with active charcoal).

Matrix Effect

No matrix effect was observed when QCs prepared in matrix were compared with those prepared in neat solution

S1P Endogenous Concentration

The endogenous level of S1P in 6 lots of screened blank matrix ranged from 19.1 to 157 ng/mL. A single lot was quantified (150 ng/mL) and used to prepare MQC (endogenous level) and HQC (200 ng/mL + endogenous level) samples.

Conclusions

  • A sensitive, selective, and automation friendly method capable of assaying S1P in human plasma was developed and validated to support clinical trials using S1P as a biomarker.
  • Excellent recovery of S1P was achieved by adjusting the extraction solvent composition.
  • The method could be applied to other phospholipids that pose similar challenges in quantitative recovery.


Acknowledgement

Guodong (Gordon) Gu, Michelle Black, Deping Cheng, Yinghe Li, Yifan Shi, Meng Fang, Lynn Maines
Alliance Pharma, Malvern, PA; Janssen Research and Development, Spring House, PA; Apogee Biotechnology Corporation, Hummelstown, PA

This study was financially supported by Apogee Biotechnology Corporation.


Read More

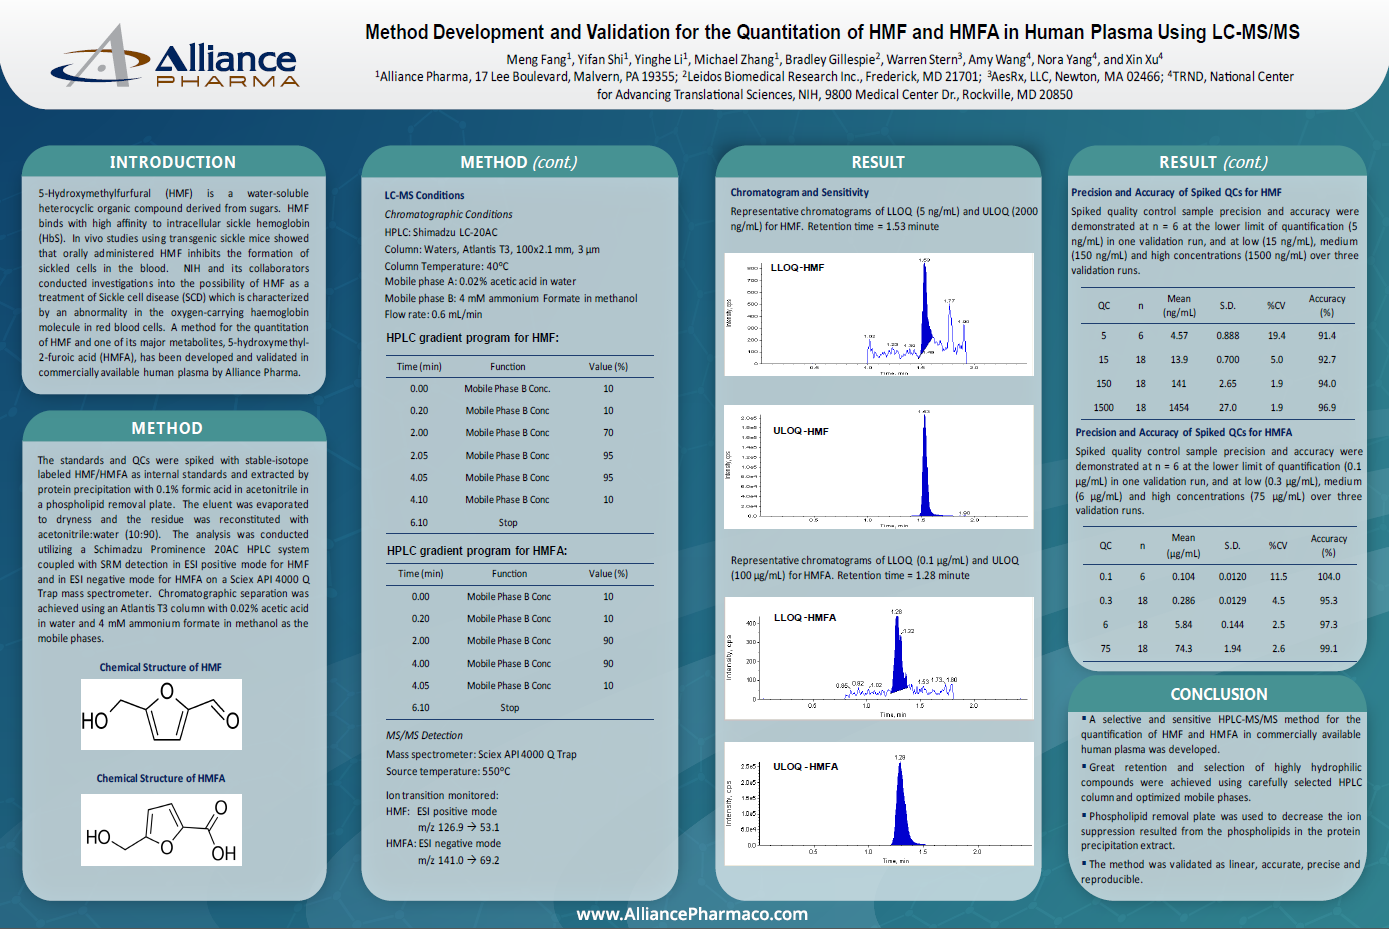
Method Development and Validation for the Quantitation of HMF and HMFA in Human Plasma Using LC-MS/MS

Jun 1, 2015 11:43:00 AM / by Dr. Feng Li posted in lc-ms/ms

5-Hydroxymethylfurfural (HMF) is a water-soluble heterocyclic organic compound derived from sugars. HMF binds with high affinity to intracellular sickle hemoglobin (HbS). In vivo studies using transgenic sickle mice showed that orally administered HMF inhibits the formation of sickled cells in the blood. NIH and its collaborators conducted investigations into the possibility of HMF as a treatment of Sickle cell disease (SCD) which is characterized by an abnormality in the oxygen-carrying haemoglobin molecule in red blood cells. A method for the quantitation of HMF and one of its major metabolites, 5-hydroxymethyl-2-furoic acid (HMFA), has been developed and validated in commercially available human plasma by Alliance Pharma.

LCMSMS method development HMF.png

Method

The standards and QCs were spiked with stable-isotope labeled HMF/HMFA as internal standards and extracted by protein precipitation with 0.1% formic acid in acetonitrile in a phospholipid removal plate. The eluent was evaporated to dryness and the residue was reconstituted with acetonitrile:water (10:90). The analysis was conducted utilizing a Schimadzu Prominence 20AC HPLC system coupled with SRM detection in ESI positive mode for HMF and in ESI negative mode for HMFA on a Sciex API 4000 Q Trap mass spectrometer. Chromatographic separation was achieved using an Atlantis T3 column with 0.02% acetic acid in water and 4 mM ammonium formate in methanol as the mobile phases.

LC-MS Conditions

Chromatographic Conditions
HPLC: Shimadzu LC-20AC
Column:Waters, Atlantis T3, 100x2.1mm, 3 μm
Column Temperature: 40oC
Mobile phase A: 0.02% acetic acid in water
Mobile phase B: 4 mM ammonium Formate in methanol
Flow rate: 0.6 mL/min

MS/MS Detection

Mass spectrometer: Sciex API 4000 Q Trap
Source temperature: 550oC
Ion transition monitored:
HMF: ESI positive mode
m/z 126.9 → 53.1
HMFA: ESI negative mode
m/z 141.0 → 69.2

Precision and Accuracy of Spiked QCs for HMF

Spiked quality control sample precision and accuracy were demonstrated at n = 6 at the lower limit of quantification (5 ng/mL) in one validation run, and at low (15 ng/mL), medium (150 ng/mL) and high concentrations (1500 ng/mL) over three validation runs.

Precision and Accuracy of Spiked QCs for HMFA

Spiked quality control sample precision and accuracy were demonstrated at n = 6 at the lower limit of quantification (0.1 μg/mL) in one validation run, and at low (0.3 μg/mL), medium (6 μg/mL) and high concentrations (75 μg/mL) over three validation runs.

Conclusion

  • A selective and sensitive HPLC-MS/MS method for the quantification of HMF and HMFA in commercially available human plasma was developed. 
  • Great retention and selection of highly hydrophilic compounds were achieved using carefully selected HPLC column and optimized mobile phases.
  • Phospholipid removal plate was used to decrease the ion suppression resulted from the phospholipids in the protein precipitation extract.
  • The method was validated as linear, accurate, precise and reproducible.


Acknowledgements

Meng Fang, Yifan Shi, Yinghe Li, Michael Zhang, Bradley Gillespie, Warren Stern, Amy Wang, Nora Yang, and Xin Xu
Alliance Pharma, 17 Lee Boulevard, Malvern, PA 19355; Leidos Biomedical Research Inc., Frederick, MD 21701; AesRx, LLC, Newton, MA 02466; TRND, National Center for Advancing Translational Sciences, NIH, 9800 Medical Center Dr., Rockville, MD 20850

Read More

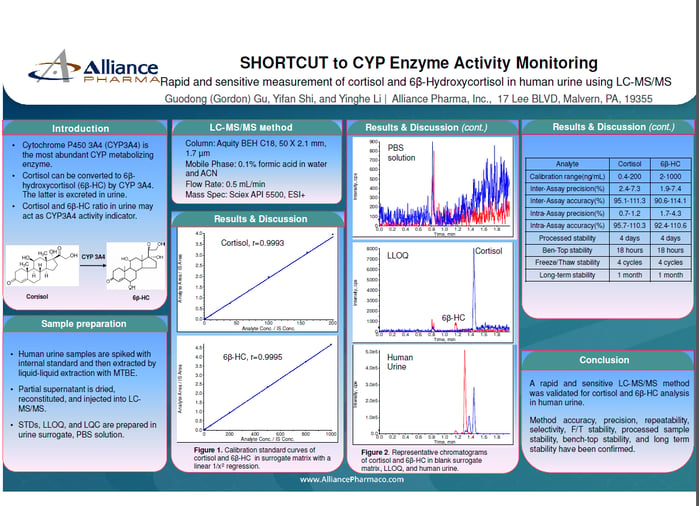
SHORTCUT to CYP Enzyme Activity Monitoring

Nov 1, 2014 10:41:00 AM / by Dr. Feng Li posted in lc-ms/ms

Rapid and sensitive measurement of cortisol and 6-Hydroxycortisol in human urine using LC-MS/MS.

Cytochrome P450 3A4 (CYP3A4) is the most abundant CYP metabolizing
enzyme. Cortisol can be converted to 6ß-hydroxycortisol (6ß-HC) by CYP 3A4. The latter is excreted in urine. Cortisol and 6ß-HC ratio in urine may act as CYP3A4 activity indicator.

LC-MS/MS cyp enzyme activity monitoring

Sample Preparation

  • Human urine samples are spiked with internal standard and then extracted by liquid-liquid extraction with MTBE.
  • Partial supernatant is dried, reconstituted, and injected into LC-MS/MS.
  • STDs, LLOQ, and LQC are prepared in urine surrogate, PBS solution.


LC-MS/MS Method

Column: Aquity BEH C18, 50 X 2.1 mm, 1.7 μm
Mobile Phase: 0.1% formic acid in water and ACN
Flow Rate: 0.5 mL/min
Mass Spec: Sciex API 5500, ESI+

Results

Analyte Cortisol 6ß-HC
Calibration range(ng/mL) 0.4-200 2-1000
Inter-Assay precision(%) 2.4-7.3 1.9-7.4
Inter-Assay accuracy(%) 95.1-111.3 90.6-114.1
Intra-Assay precision(%) 0.7-1.2 1.7-4.3
Intra-Assay accuracy(%) 95.7-110.3 92.4-110.6
Processed stability 4 days 4 days
Ben-Top stability 18 hours 18 hours
Freeze/Thaw stability 4 cycles 4 cycles
Long-term stability 1 month 1 month


Conclusion

A rapid and sensitive LC-MS/MS method was validated for cortisol and 6ß-HC analysis
in human urine. Method accuracy, precision, repeatability, selectivity, F/T stability, processed sample stability, bench-top stability, and long term stability have been confirmed.

Scientists

Guodong (Gordon) Gu, Yifan Shi, and Yinghe Li

Read More

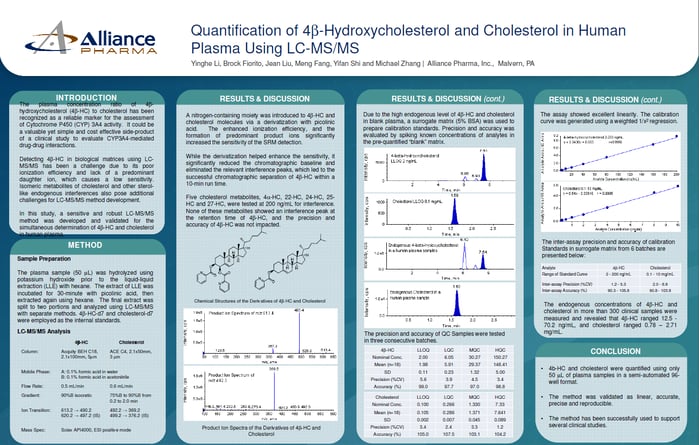
Quantification of 4b-Hydroxycholesterol and Cholesterol in Human Plasma Using LC-MS/MS

Nov 1, 2014 9:47:00 AM / by Dr. Feng Li posted in lc-ms/ms

The plasma concentration ratio of 4b-hydroxycholesterol (4b-HC) to cholesterol has been recognized as a reliable marker for the assessment of Cytochrome P450 (CYP) 3A4 activity. It could be a valuable yet simple and cost effective side-product of a clinical study to evaluate CYP3A4-mediated drug-drug interactions.

Detecting 4b-HC in biological matrices using LC-MS/MS has been a challenge due to its poor ionization efficiency and lack of a predominant daughter ion, which causes a low sensitivity. Isomeric metabolites of cholesterol and other sterollike endogenous interferences also pose additional challenges for LC-MS/MS method development. In this study, a sensitive and robust LC-MS/MS method was developed and validated for the simultaneous determination of 4b-HC and cholesterol in human plasma.

LC-MS/MS 4b-Hydroxycholesterol and Cholesterol in Human Plasma

Sample Preparation

The plasma sample (50 μL) was hydrolyzed using potassium hydroxide prior to the liquid-liquid extraction (LLE) with hexane. The extract of LLE was incubated for 30-minute with picolinic acid, then extracted again using hexane. The final extract was split to two portions and analyzed using LC-MS/MS with separate methods. 4b-HC-d7 and cholesterol-d7 were employed as the internal standards.

LC-MS/MS Analysis


A nitrogen-containing moiety was introduced to 4b-HC and cholesterol molecules via a derivatization with picolinic acid. The enhanced ionization efficiency, and the formation of predominant product ions significantly increased the sensitivity of the SRM detection.

While the derivatization helped enhance the sensitivity, it significantly reduced the chromatographic baseline and eliminated the relevant interference peaks, which led to the successful chromatographic separation of 4b-HC within a 10-min run time. Five cholesterol metabolites, 4a-HC, 22-HC, 24-HC, 25-HC and 27-HC, were tested at 200 ng/mL for interference. None of these metabolites showed an interference peak at the retention time of 4b-HC, and the precision and accuracy of 4b-HC was not impacted.

Due to the high endogenous level of 4b-HC and cholesterol in blank plasma, a surrogate matrix (5% BSA) was used to prepare calibration standards. Precision and accuracy was evaluated by spiking known concentrations of analytes in the pre-quantified “blank” matrix.

The precision and accuracy of QC Samples were tested in three consecutive batches. The assay showed excellent linearity. The calibration curve was generated using a weighted 1/x2 regression. The endogenous concentrations of 4b-HC and cholesterol in more than 300 clinical samples were measured and revealed that 4b-HC ranged 12.5 -70.2 ng/mL, and cholesterol ranged 0.78 – 2.71 mg/mL.

Conclusions

  • 4b-HC and cholesterol were quantified using only 50 μL of plasma samples in a semi-automated 96-
    well format.
  • The method was validated as linear, accurate,
    precise and reproducible.
  • The method has been successfully used to support several clinical studies


Scientists

Yinghe Li, Brock Fiorito, Jean Liu, Meng Fang, Yifan Shi and Michael Zhang

Read More

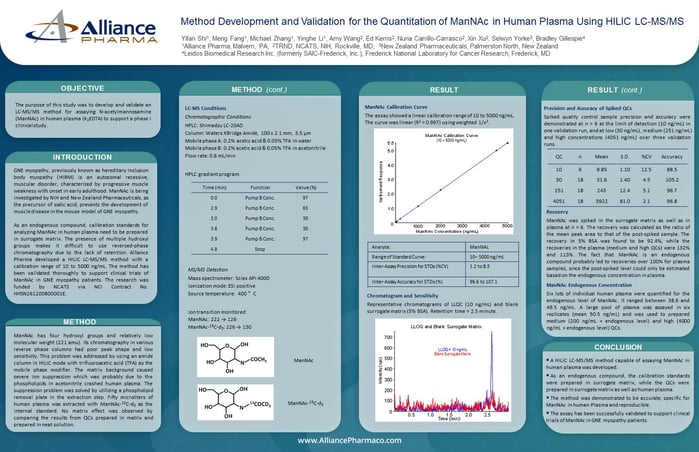
Method Development and Validation for the Quantitation of ManNAc in Human Plasma Using HILIC LC-MS/MS

Jun 1, 2014 11:28:00 AM / by Dr. Feng Li posted in lc-ms/ms

The purpose of this study was to develop and validate an LC-MS/MS method for assaying N-acetylmannosamine (ManNAc) in human plasma (K2EDTA) to support a phase I clinical study.

GNE myopathy, previously known as hereditary inclusion body myopathy (HIBM) is an autosomal recessive, muscular disorder, characterized by progressive muscle weakness with onset in early adulthood. ManNAc is being investigated by NIH and New Zealand Pharmaceuticals, as the precursor of sialic acid, prevents the development of muscle disease in the mouse model of GNE myopathy.

As an endogenous compound, calibration standards for analyzing ManNAc in human plasma need to be prepared in surrogate matrix. The presence of multiple hydroxyl groups makes it difficult to use reversed-phase chromatography due to the lack of retention. Alliance Pharma developed a HILIC LC-MS/MS method with a calibration range of 10 to 5000 ng/mL. The method has been validated thoroughly to support clinical trials of ManNAc in GNE myopathy patients. The research was funded by NCATS via NCI Contract No. HHSN261200800001E.

ManNAc LC-MS/MS

Method

ManNAc has four hydroxyl groups and relatively low molecular weight (221 amu). Its chromatography in various reverse phase columns had poor peak shape and low sensitivity. This problem was addressed by using an amide column in HILIC mode with trifluoroacetic acid (TFA) as the mobile phase modifier. The matrix background caused severe ion suppression which was probably due to the phospholipids in acetonitrile crashed human plasma. The suppression problem was solved by utilizing a phospholipid removal plate in the extraction step. Fifty microliters of human plasma was extracted with ManNAc-13C-d3 as the internal standard. No matrix effect was observed by comparing the results from QCs prepared in matrix and prepared in neat solution.

LC-MS Conditions

Chromatographic Conditions

HPLC: Shimadzu LC-20AD

Column: Waters XBridge Amide, 100 x 2.1 mm, 3.5 µm

Mobile phase A: 0.2% acetic acid & 0.05% TFA in water

Mobile phase B: 0.2% acetic acid & 0.05% TFA in acetonitrile

Flow rate: 0.8 mL/min

MS/MS Detection

Mass spectrometer: Sciex API 4000

Ionization mode: ESI positive

Source temperature: 400 °C

Ion transition monitored:

ManNAc: 222 → 126

ManNAc-13C-d3: 226 → 130

Results

ManNAc Calibration Curve  

The assay showed a linear calibration range of 10 to 5000 ng/mL. The curve was linear (R2 > 0.997) using weighted 1/x2.

Chromatogram and Sensitivity

Representative chromatograms of LLQC (10 ng/mL) and blank surrogate matrix (5% BSA). Retention time = 2.5 minute.

Precision and Accuracy of Spiked QCs

Spiked quality control sample precision and accuracy were demonstrated at n = 6 at the limit of detection (10 ng/mL) in one validation run, and at low (30 ng/mL), medium (251 ng/mL) and high concentrations (4051 ng/mL) over three validation runs.

Recovery

ManNAc was spiked in the surrogate matrix as well as in plasma at n = 6. The recovery was calculated as the ratio of the mean peak area to that of the post-spiked sample. The recovery in 5% BSA was found to be 92.4%, while the recoveries in the plasma (medium and high QCs) were 132% and 113%. The fact that ManNAc is an endogenous compound probably led to recoveries over 100% for plasma samples, since the post-spiked level could only be estimated based on the endogenous concentration in plasma.

ManNAc Endogenous Concentration 

Six lots of individual human plasma were quantified for the endogenous level of ManNAc. It ranged between 38.6 and 49.5 ng/mL. A large pool of plasma was assayed in six replicates (mean 50.5 ng/mL) and was used to prepared medium (200 ng/mL + endogenous level) and high (4000 ng/mL + endogenous level) QCs.

Conclusion

  • A HILIC LC-MS/MS method capable of assaying ManNAc in human plasma was developed.
  • As an endogenous compound, the calibration standards were prepared in surrogate matrix, while the QCs were prepared in surrogate matrix as well as human plasma.
  • The method was demonstrated to be accurate, specific for ManNAc in human Plasma and reproducible.
  • The assay has been successfully validated to support clinical trials of ManNAc in GNE myopathy patients.


Acknowledgements

Yifan Shi, Meng Fang, Michael Zhang, Yinghe Li, Amy Wang, Ed Kerns, Nuria Carrillo-Carrasco, Xin Xu, Selwyn Yorke, Bradley Gillespie

Alliance Pharma, Malvern, PA;  TRND, NCATS, NIH, Rockville, MD;  New Zealand Pharmaceuticals, Palmerston North, New Zealand

Leidos Biomedical Research Inc. (formerly SAIC-Frederick, Inc.), Frederick National Laboratory for Cancer Research, Frederick, MD


Read More

A Rapid and Sensitive Method for the Quantification of Goserelin in Human Plasma Using HPLC-MS/MS

Jun 1, 2014 9:22:00 AM / by Dr. Feng Li posted in lc-ms/ms

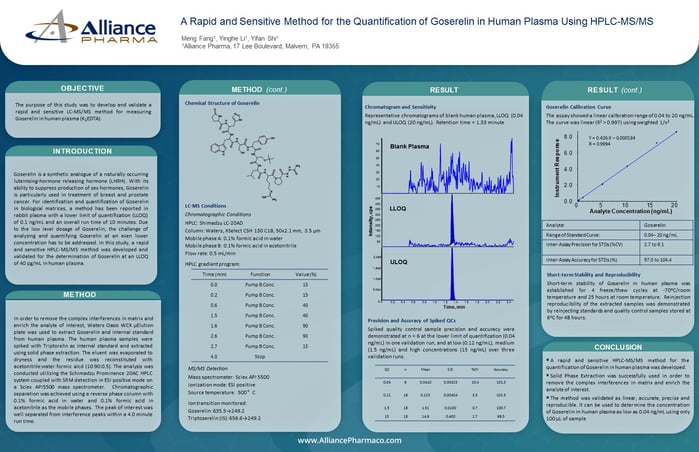
The purpose of this study was to develop and validate a rapid and sensitive LC-MS/MS method for measuring Goserelin in human plasma (K2EDTA).

Goserelin is a synthetic analogue of a naturally occurring luteinising-hormone releasing hormone (LHRH). With its ability to suppress production of sex hormones, Goserelin is particularly used in treatment of breast and prostate cancer. For identification and quantification of Goserelin in biological matrices, a method has been reported in rabbit plasma with a lower limit of quantification (LLOQ) of 0.1 ng/mL and an overall run time of 10 minutes. Due to the low level dosage of Goserelin, the challenge of analyzing and quantifying Goserelin at an even lower concentration has to be addressed. In this study, a rapid and sensitive HPLC-MS/MS method was developed and validated for the determination of Goserelin at an LLOQ of 40 pg/mL in human plasma.

Alliance Pharma LC-MS/MS Bioanalytical Study

Method

In order to remove the complex interferences in matrix and enrich the analyte of interest, Waters Oasis WCX µElution plate was used to extract Goserelin and internal standard from human plasma. The human plasma samples were spiked with Triptorelin as internal standard and extracted using solid phase extraction. The eluent was evaporated to dryness and the residue was reconstituted with acetonitrile:water:formic aicd (10:90:0.5). The analysis was conducted utilizing the Schimadzu Prominence 20AC HPLC system coupled with SRM detection in ESI positive mode on a Sciex API5500 mass spectrometer.  Chromatographic separation was achieved using a reverse phase column with 0.1% formic acid in water and 0.1% formic acid in acetonitrile as the mobile phases.  The peak of interest was well separated from interference peaks within a 4.0 minute run time.

Short-term Stability and Reproducibility

Short-term stability of Goserelin in human plasma was established for 4 freeze/thaw cycles at -70oC/room temperature and 25 hours at room temperature.  Reinjection reproducibility of the extracted samples was demonstrated by reinjecting standards and quality control samples stored at 6oC for 48 hours.

Conclusion

  • A rapid and sensitive HPLC-MS/MS method for the quantification of Goserelin in human plasma was developed.
  • Solid Phase Extraction was successfully used in order to remove the complex interferences in matrix and enrich the analyte of interest.
  • The method was validated as linear, accurate, precise and reproducible. It can be used to determine the concentration of Goserelin in human plasma as low as 0.04 ng/mL using only 100 µL of sample.


Scientists

Meng Fang, Yinghe Li, Yifan Shi

Read More

Quantification of 25-hydroxyvitamin D3 in Rat Serum Using Derivatization to Enhance LC-MS/MS Sensitivity

Jun 1, 2013 9:13:00 AM / by Dr. Feng Li posted in lc-ms/ms

Circulating 25-hydroxyvitamin D3 (25-OHVD3) is widely accepted as the most useful biomarker for evaluating vitamin D status and diagnosing certain diseases. 

Determination of 25-OHVD3 is important during some drug development since the increasing concern of these drugs potentially affecting vitamin D absorption. 

Detecting 25-OHVD3 in biological matrix using LC-MS/MS has been challenged due to its poor ionization efficiency and lack of a predominant daughter ion, which causes a low sensitivity.  Isomeric metabolites of vitamin D and other sterol-like endogenous interferences pose an additional challenge with chromatographic separation.

In this study, a sensitive and robust LC-MS/MS method was developed and validated for the determination of 25-OHVD3 in rat serum.

LC-MS/MS Bioanalysis Study Alliance Pharma

Sample Preparation                                                                  

The samples were prepared in 96-well format by liquid-liquid extraction with MTBE, followed by a 30-minute derivatization with picolinic acid. 25-OHVD3-d6 was employed as internal standard.

LC-MS/MS Analysis

Column: ACE C4, 100 X 4.6 mm, 3 µm particle size

Mobile Phase A: 0.1% formic acid in water

Mobile Phase B: 0.1% formic acid in acetonitrile

Gradient: 0-0.2 min, 75%B; 0.2-3.0min, 75-85%B; 3.05-5.50min, 95%B; 5.55-6.50min, 75%B

Flow rate: 1.5 mL/min

Detector: Sciex API 4000, ESI+

MRM transition: m/z 506.6 à 383.3 for 25-OHVD3

                              m/z 512.4 à 389.3 for 25-OHVD3-d6

Bioanalysis Results

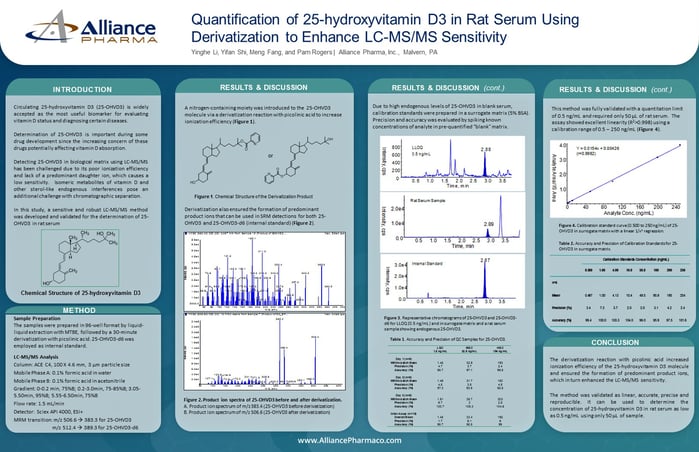
A nitrogen-containing moiety was introduced to the 25-OHVD3 molecule via a derivatization reaction with picolinic acid to increase ionization efficiency (Figure 1).

Derivatization also ensured the formation of predominant product ions that can be used in SRM detections for both 25-OHVD3 and 25-OHVD3-d6 (internal standard) (Figure 2).

Due to high endogenous levels of 25-OHVD3 in blank serum, calibration standards were prepared in a surrogate matrix (5% BSA). Precision and accuracy was evaluated by spiking known concentrations of analyte in pre-quantified “blank” matrix.

Figure 3. Representative chromatograms of 25-OHVD3 and 25-OHVD3-d6 for LLOQ (0.5 ng/mL ) and in surrogate matrix and a rat serum   sample showing endogenous 25-OHVD3.

This method was fully validated with a quantitation limit of 0.5 ng/mL and required only 50 mL of rat serum.  The assay showed excellent linearity (R2>0.998) using a calibration range of 0.5 – 250 ng/mL (Figure 4).

Conclusion 

The derivatization reaction with picolinic acid increased ionization efficiency of the 25-hydroxyvitamin D3 molecule and ensured the formation of predominant product ions, which in turn enhanced the LC-MS/MS sensitivity.

The method was validated as linear, accurate, precise and reproducible. It can be used to determine the concentration of 25-hydroxyvitamin D3 in rat serum as low as 0.5 ng/mL using only 50 mL of sample. 

Scientists

Yinghe Li, Yifan Shi, Meng Fang, and Pam Rogers 


Read More